Strategic Research And Design
My approach centered on rethinking how community college data could be leveraged through
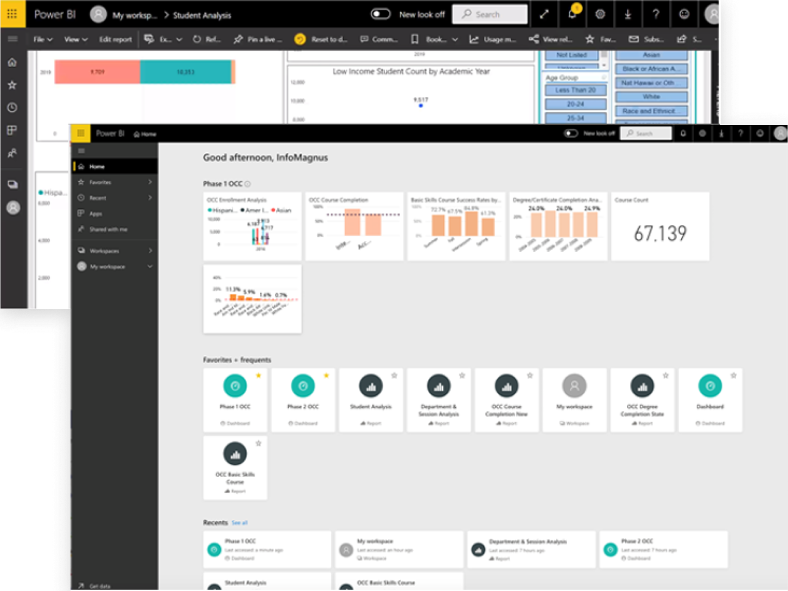
a new technology platform. I started by deconstructing the existing Power BI application
to identify all its core functionalities and the needs of its users. Key activities
included:
User Research And Personal Development: Creating detailed
personas to represent the diverse users of the application, from administrative staff to
state education grant writers
Designing User Flows: Sketching out new user journey flows
to facilitate more intuitive interactions within the application.
Design Vision: Developing new data visualizations and
interaction designs that are not only functional but also aesthetically pleasing.
A Complete Application Solution
This application transforms community college data into a comprehensive, interactive
analytics visualization suite that provides insights into both college operations and
student performance. Key features of the application include:
Insightful Overviews: Administrators can view overarching
data on college and student activities, identify trends, and make informed decisions.
User-Friendly Interface: The application allows users to
explore specific data sets, such as student demographics or course engagement details,
with the ability to drill down into more granular information.
Design Vision: Despite the complexity of the data, the
design maintains simplicity in user interactions, making the system easy to navigate and
use.
Impact And Implementation
This redesigned application offers a streamlined, single sign-on feature that presents
key data immediately upon login —which is particularly useful for high-level
decision-makers like college presidents. They can quickly access essential reports on
enrollment trends, performance metrics, and other critical indicators. The customizable
dashboard allows users to apply various filters and explore specific data points, such
as minority admissions and demographic trends, enhancing the decision-making process.
Conclusion
This college project exemplifies my ability to transform a traditional enterprise data
application into a modern, user-centric data and analytics tool. This case study
demonstrates the successful application of UX principles to create a solution that not
only meets the unique needs of community colleges but also offers scalability and
economic efficiency in its licensing model.


